Yield

A tool for farmers to track water usage, conversion and reports

My roles:

  • Interaction designer
  • User Experience designer
  • Front-end designer
  • Design Research
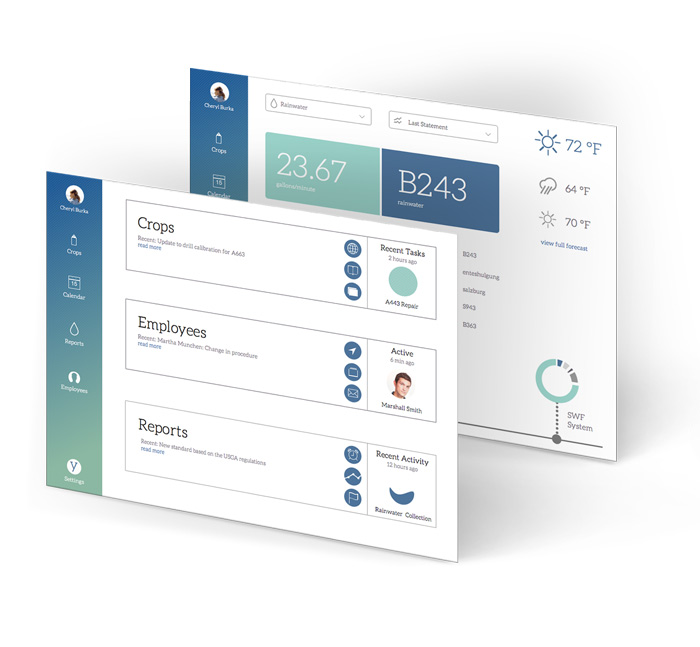
interface

Abstract:

  • Farming in California alone is a 47 billion dollar industry
  • Drought is cyclical
  • Design sprints allowed quick discovery of solutions

Logo design:

logo

The Problem

  • Farmers are affected by the drought
  • Farmers need to view the status of drip line conversions
  • Technology should be better utilized to help monitor water usage
  • Farmers have several different tasks and responsibilities

The Solution

  • To give farmers the ability to track their crops
  • To use technology to make their farms as efficient as possible
  • To make the reporting and usage processess seamless
  • Monitoring water levels and climate change isn't enough, real data with analytics is mandatory
  • Current infrastructure is faulty and dated
  • Each farmer is unique and has different levels of water rights

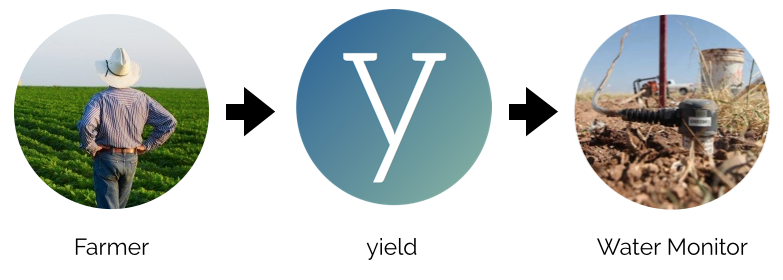
use diagram

user


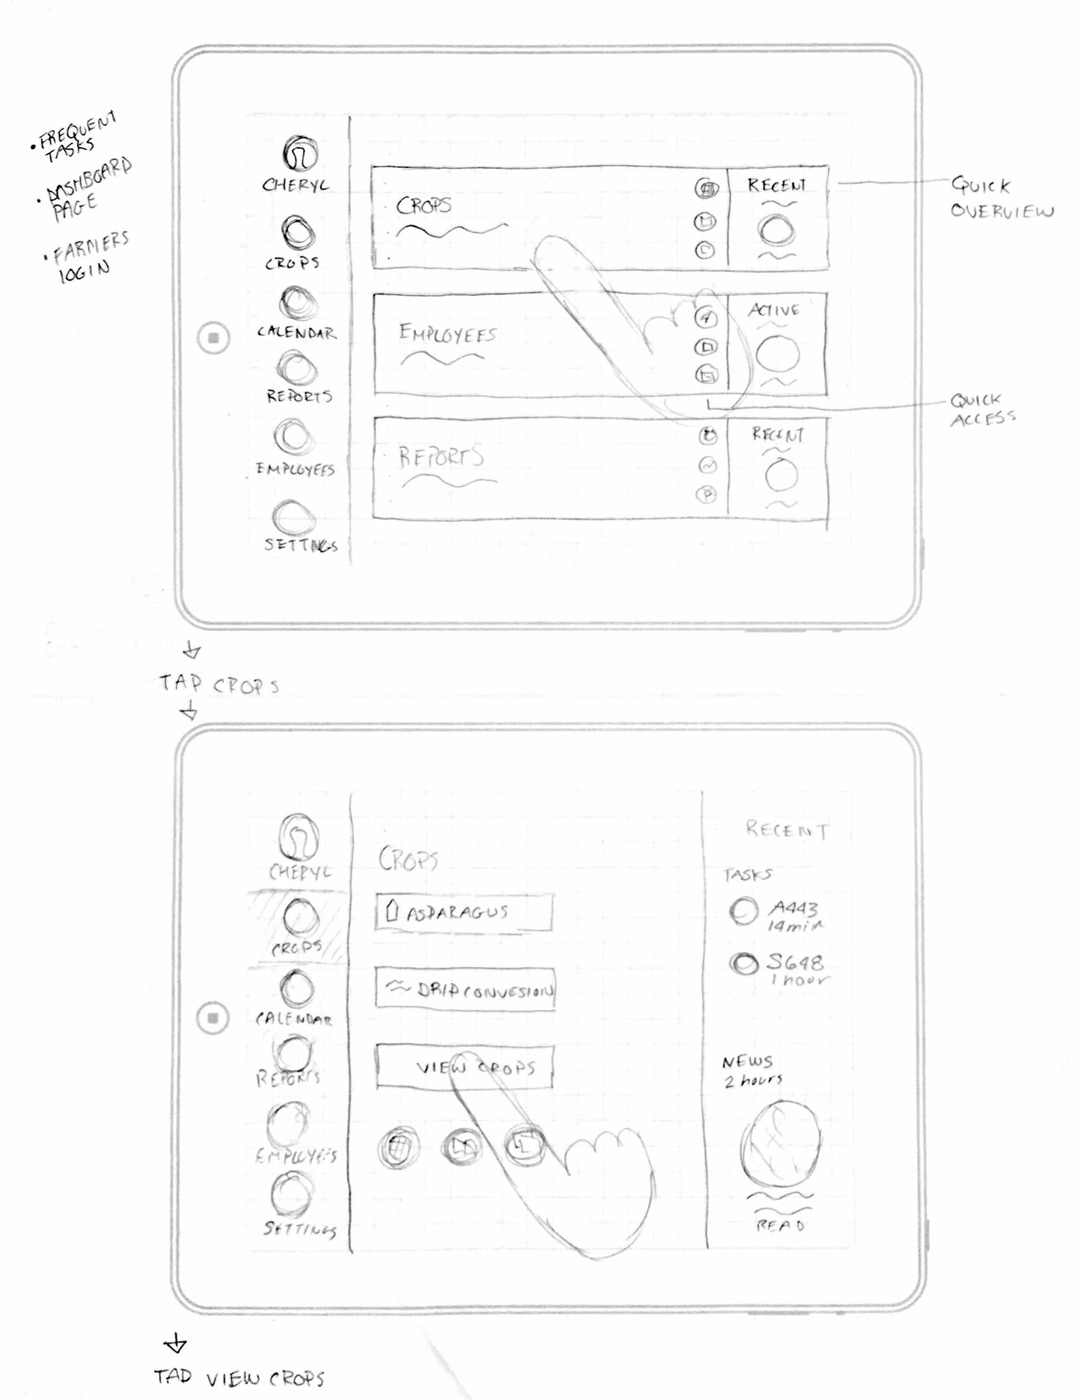
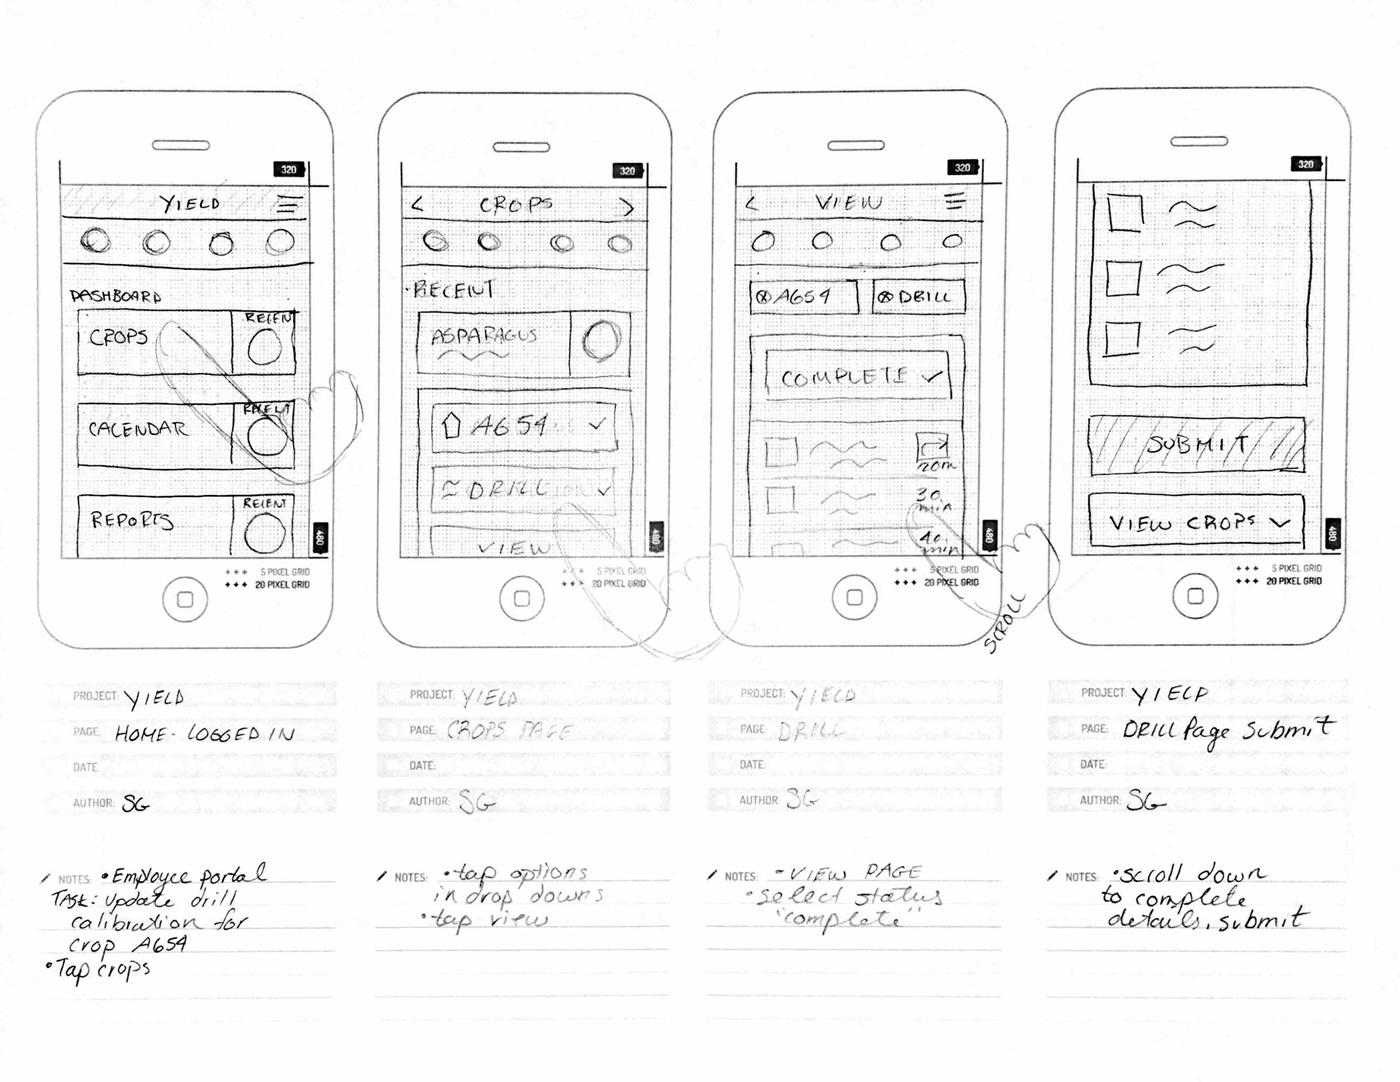
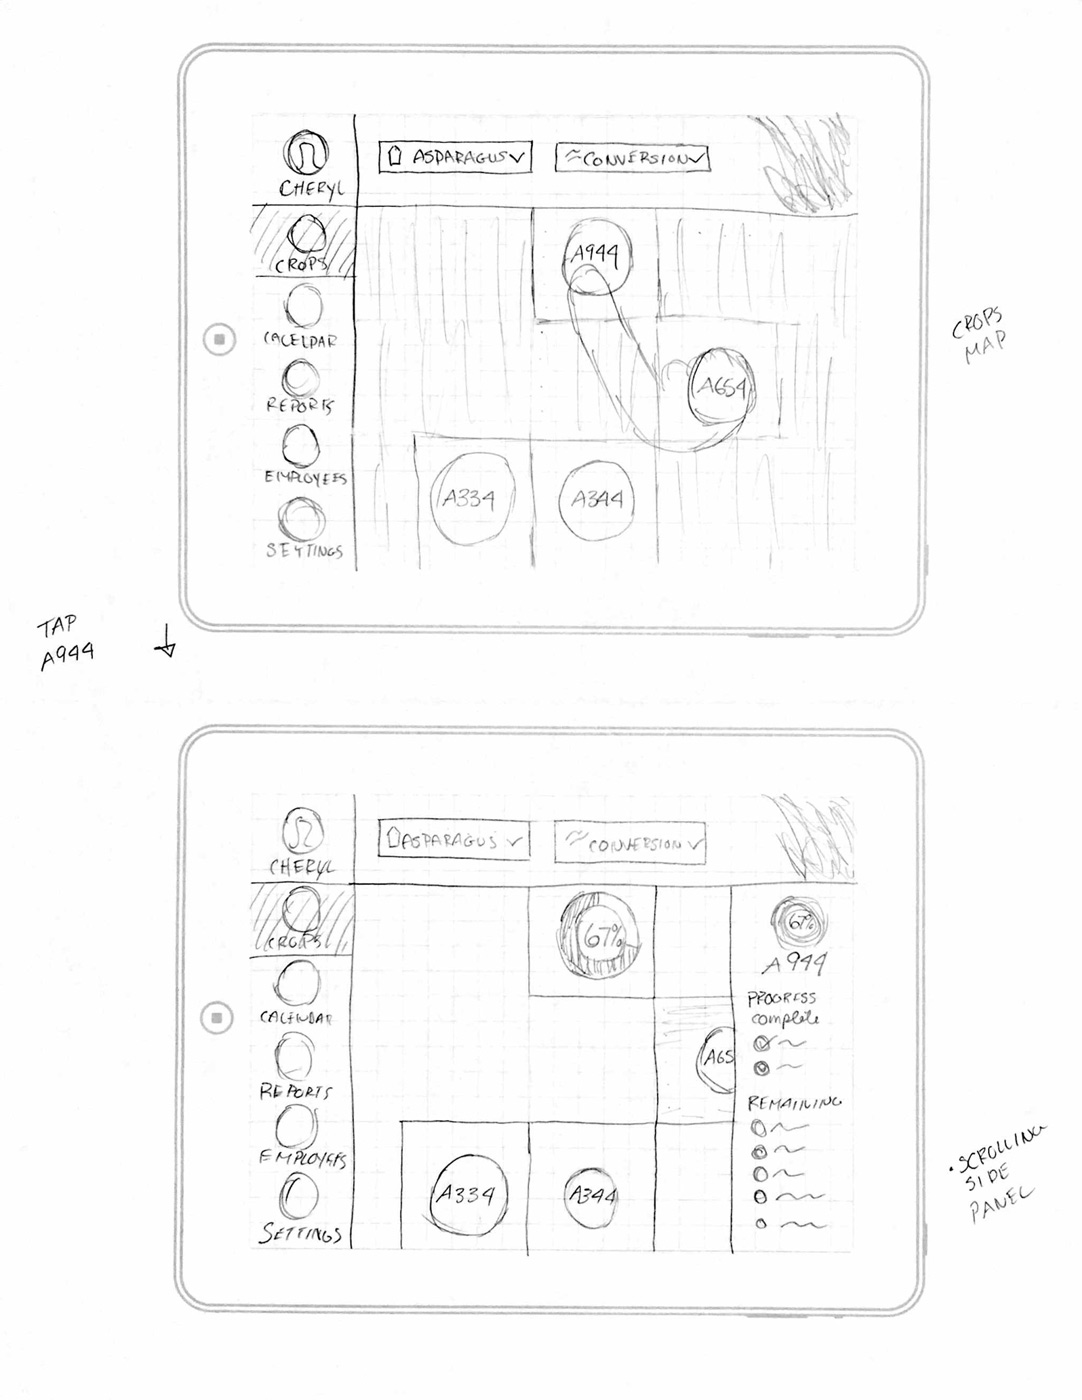
Process Sketches

iPad dashboard homepage dashboard

iPad dashboard homepage task continued dashboard
Mobile dashboard task mobile


Wireframes

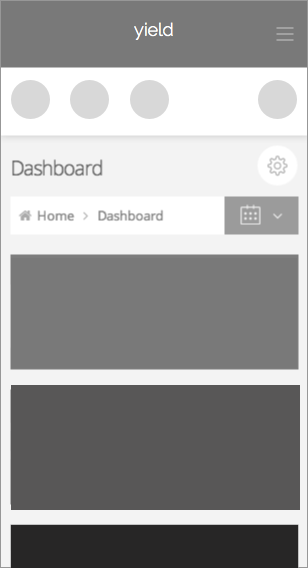
Mobile dashboard main nav

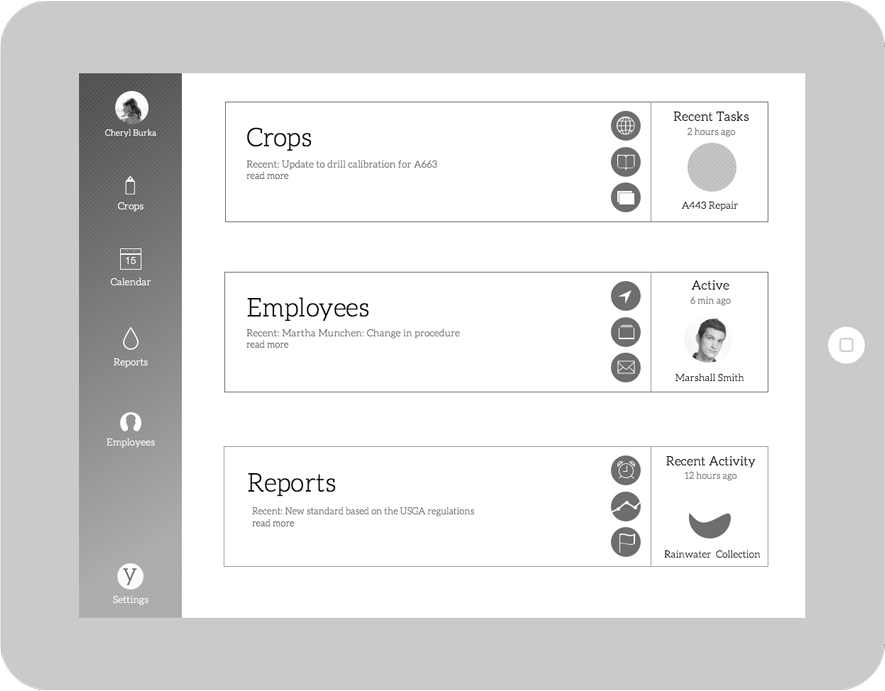
iPad Dashboard (responsive) main nav


Mindmap

  • Farmers have many responsibilities
  • Managing water usage is beneficial
  • Each farmer has different needs
  • Many farmers are tech savvy

mindmap